Validation Wireless Survey in Ekahau/Hamina.
As a network engineer that designs, builds, configures, and manages networks for corporate events at locations that are off the company's campuses such as convention centers and hotels, I consider the wireless survey after access point deployment and configuration to be a crucial part of the validation process. The event's environment is very fast paced, and we only have a few days for the network build and test because of the limited possession time that the company has at the convention center. Usually, we have 3-5 days to build the wired/wireless network and only 1-2 days for RF configurations and tuning based on the environment. Even though most of the wireless settings (channels and TPC) are done in the planning and design phase, real time adjustments are frequently necessary because the event's environment is ever changing due to last minute requirements from the organizing team.
Whether an event has 13,000 or 100 clients, we can utilize Ekahau AI Pro with SideKick 2 or Hamina Onsite with Oscium Nomad because the process is very similar. I always try to get a map or layout (CAD, .dwg, .pdf, .jpg, or .png file) of the wireless coverage areas from the production company that is in charge of deploying the audio/video because they have the exact arrangements of the ballrooms, exhibit floors, or meeting rooms with the trusses' heights, number of seats, attendees etc. Then I can use the original layouts that I used for the wireless design and access points deployment for the validation surveys.
The first step after uploading the layout file to my device (iPhone, iPad, or laptop) with the survey program is to set up a scale in feet. This step is necessary for the software to correctly calculate and interpret the gathered data on the layout in the form of a heatmap with corresponding RSSI (dBm) in a specific spectrum (2.4, 5, or 6GHz) as it is in signal strength visualization for example. The most common method to set the scale (ruler visualization) is based on the doorframe's measurement, which is 3 feet across by default, but it is also a very inaccurate measurement.
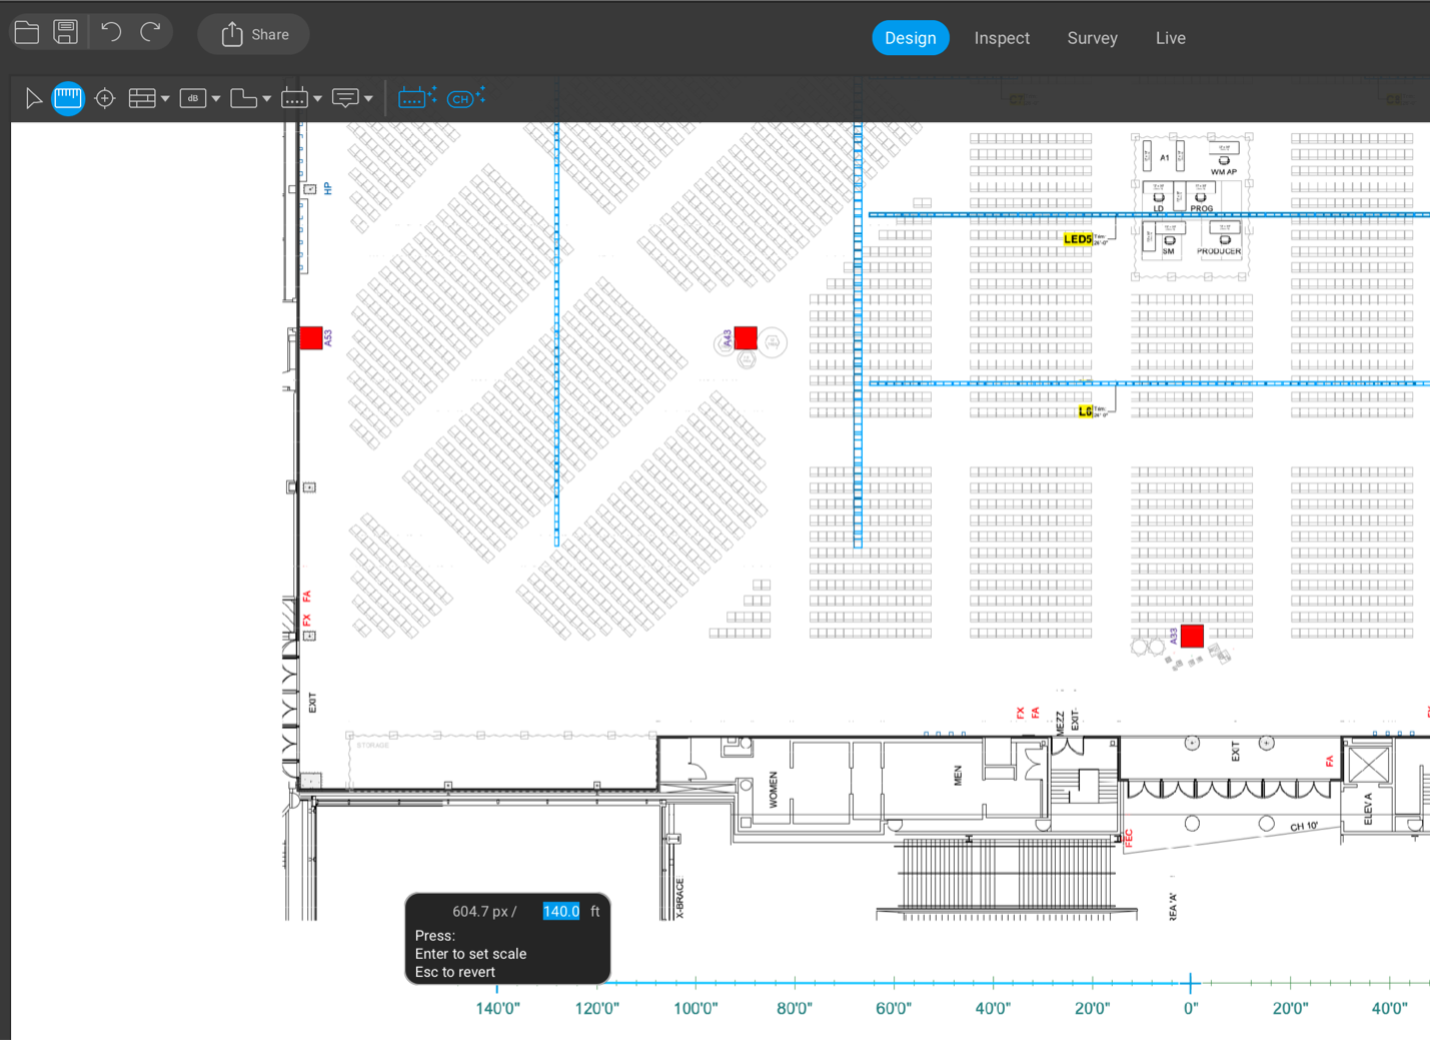 Setting up a scale at Ekahau AI Pro for either wireless design or survey.
Using the micro scale measurement could lead to inaccuracies because three feet is usually not long enough for us to capture the mouse pixelation as precisely as we would like to compared to using much longer distances with several hundred feet. If we miss several pixels on the three feet micro scale, then the off inaccuracy will multiply by hundreds or even thousands of feet causing the measurements and heatmap interpretation to be off by a significant number. Therefore, the longer the measurement for the scale, the more accurate it will be because even if it is off (less or more) by a few pixels, it is not as significant on the macro scale. The more accurate method (or process) would be to use a longer measurement such as a long truss or some long wall that is a significant part of the layout or one that can be measured with a laser measuring tool locally at the site.
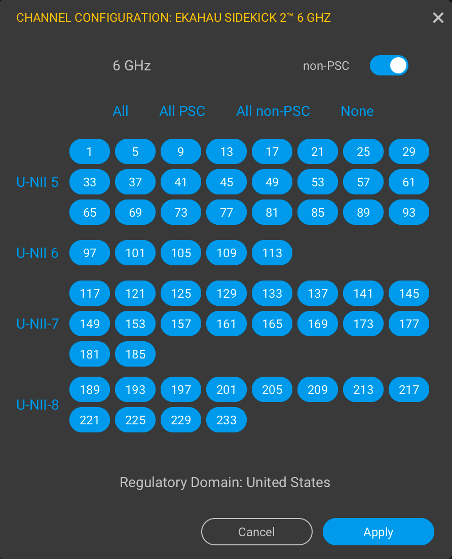
The next step is to check all the bands and all the channels in the survey software that we want to capture. While we are collecting the RF data in Ekahau AI Pro, it is easier to turn off all the visualizations such as the access points to have a clearer view without any distractions. These settings can easily be adjusted back and forth to hide or make them visible. I usually use the "Continuous Survey" with a mouse click every time I stop or make a turn. Then I can continue walking and surveying areas that are accessible.
 |
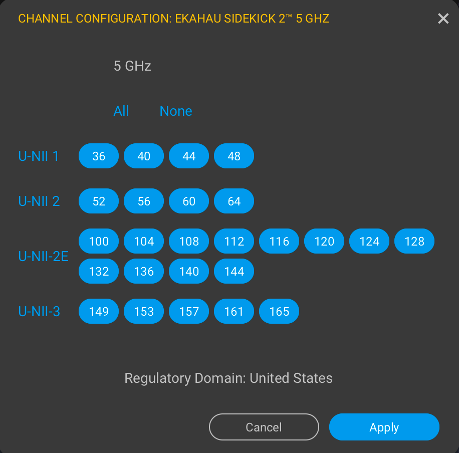 |
6 & 5GHz channels selection for data capture in the in Ekahau AI Pro with Sidekick 2
It is essential to save several copies of the file in case we must resurvey any areas or add something later. Also, it is important to remember to keep saving progress locally or to a cloud periodically because we want to avoid walking the whole survey area for several hours and find out at the end that the file wasn't saved properly. Then we would have to charge the survey device batteries and re-survey the area again. As a result, we would lose valuable time and waste energy that could be easily avoided. Validating periodically ensures that the devices capture the data through the survey. Otherwise, the survey devices could get turned off or the cables could get disconnected by being pulled out when they catch on some obstacles while we conduct the walkthrough survey. We must make sure that devices are connected to each other and that we are able to see updates across all the surveyed spectrums. Since the software collects the data and spreads the data between the mouse clicks, we must ensure that we keep a steady pace at all time. If the walking pace keeps changing, the collected data between areas could generate different results.
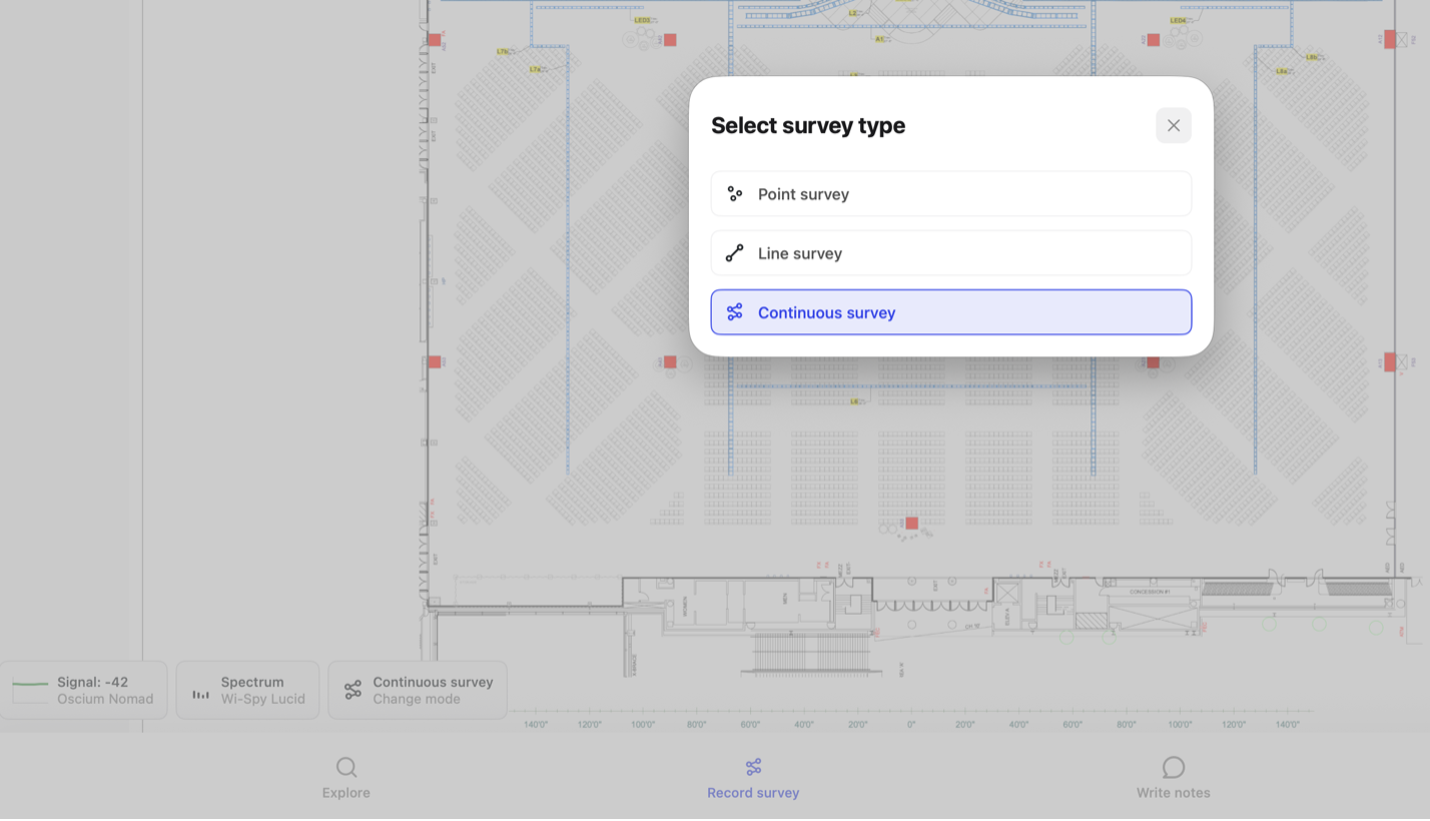 Setup a continuous survey in Hamina Onsite with Oscium Nomad.
I survey high density seating areas every third row which is about every 10 feet. It keeps the measures consistent and helps to avoid obstacles such as handrails that would break the walkthrough pace. Most of the stadium seating has handrails in the aisles that span between two rows, so every third row has a gap that runs from one side of the aisle to the other. So logically, surveying every third row is easiest since it offers the path of least resistance when walking.
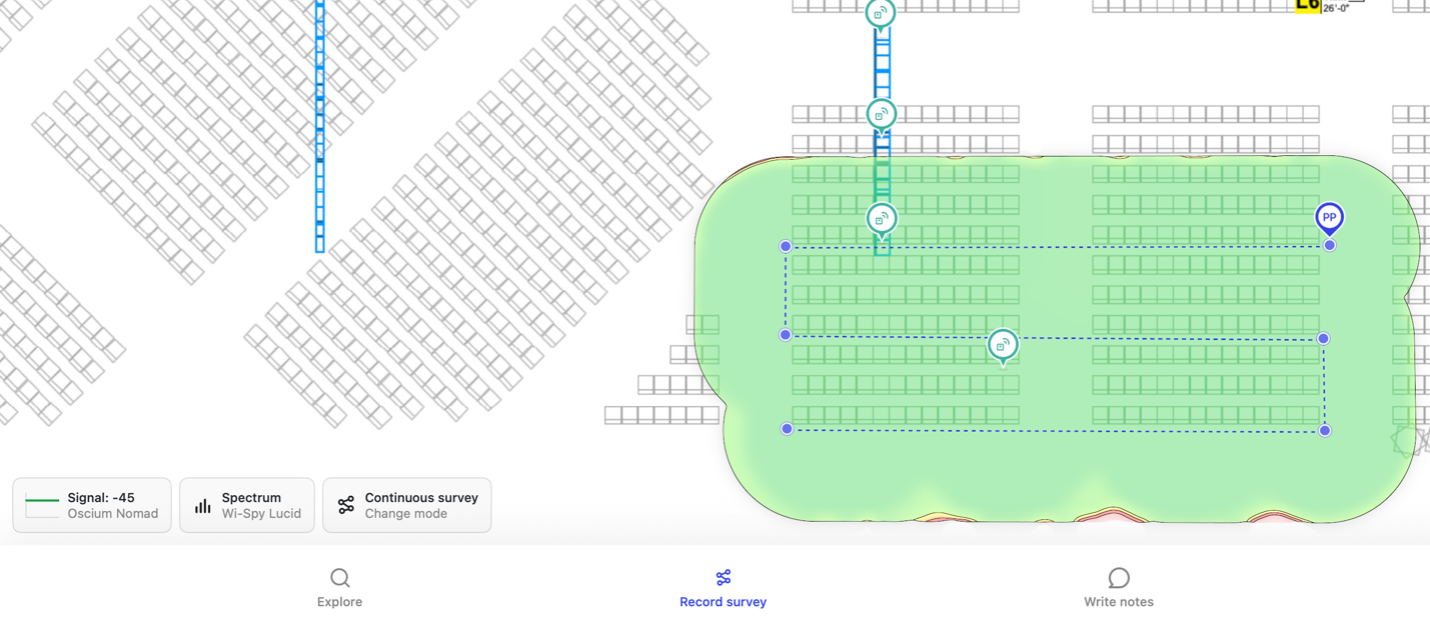 Continuous survey capture in Hamina Onsite with Oscium Nomad every third row (~10 feet)
Finally, whenever possible keep the survey devices with clear line of sight toward the surveying access points. Avoid blocking devices with your body to prevent unnecessary absorption or alteration of the collected RF signal for a consistency.

Comments: